Projects
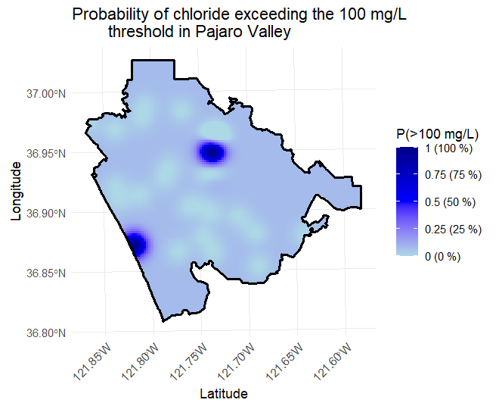
Saltwater intrusion in the Pajaro Valley and Los Angeles County
This project assessed saltwater intrusion risk in two major California coastal aquifers, Pajaro Valley and Los Angeles County, by integrating groundwater chloride data with spatial modeling. Using ArcGIS and R, Ordinary and Indicator Kriging were applied to identify areas with a higher risk of Salwater intrusion.
Key deliverables included high-resolution chloride exceedance probability maps and a technical report outlining data trends and management implications, supporting water managers in prioritizing mitigation efforts and informing long-term groundwater sustainability planning.
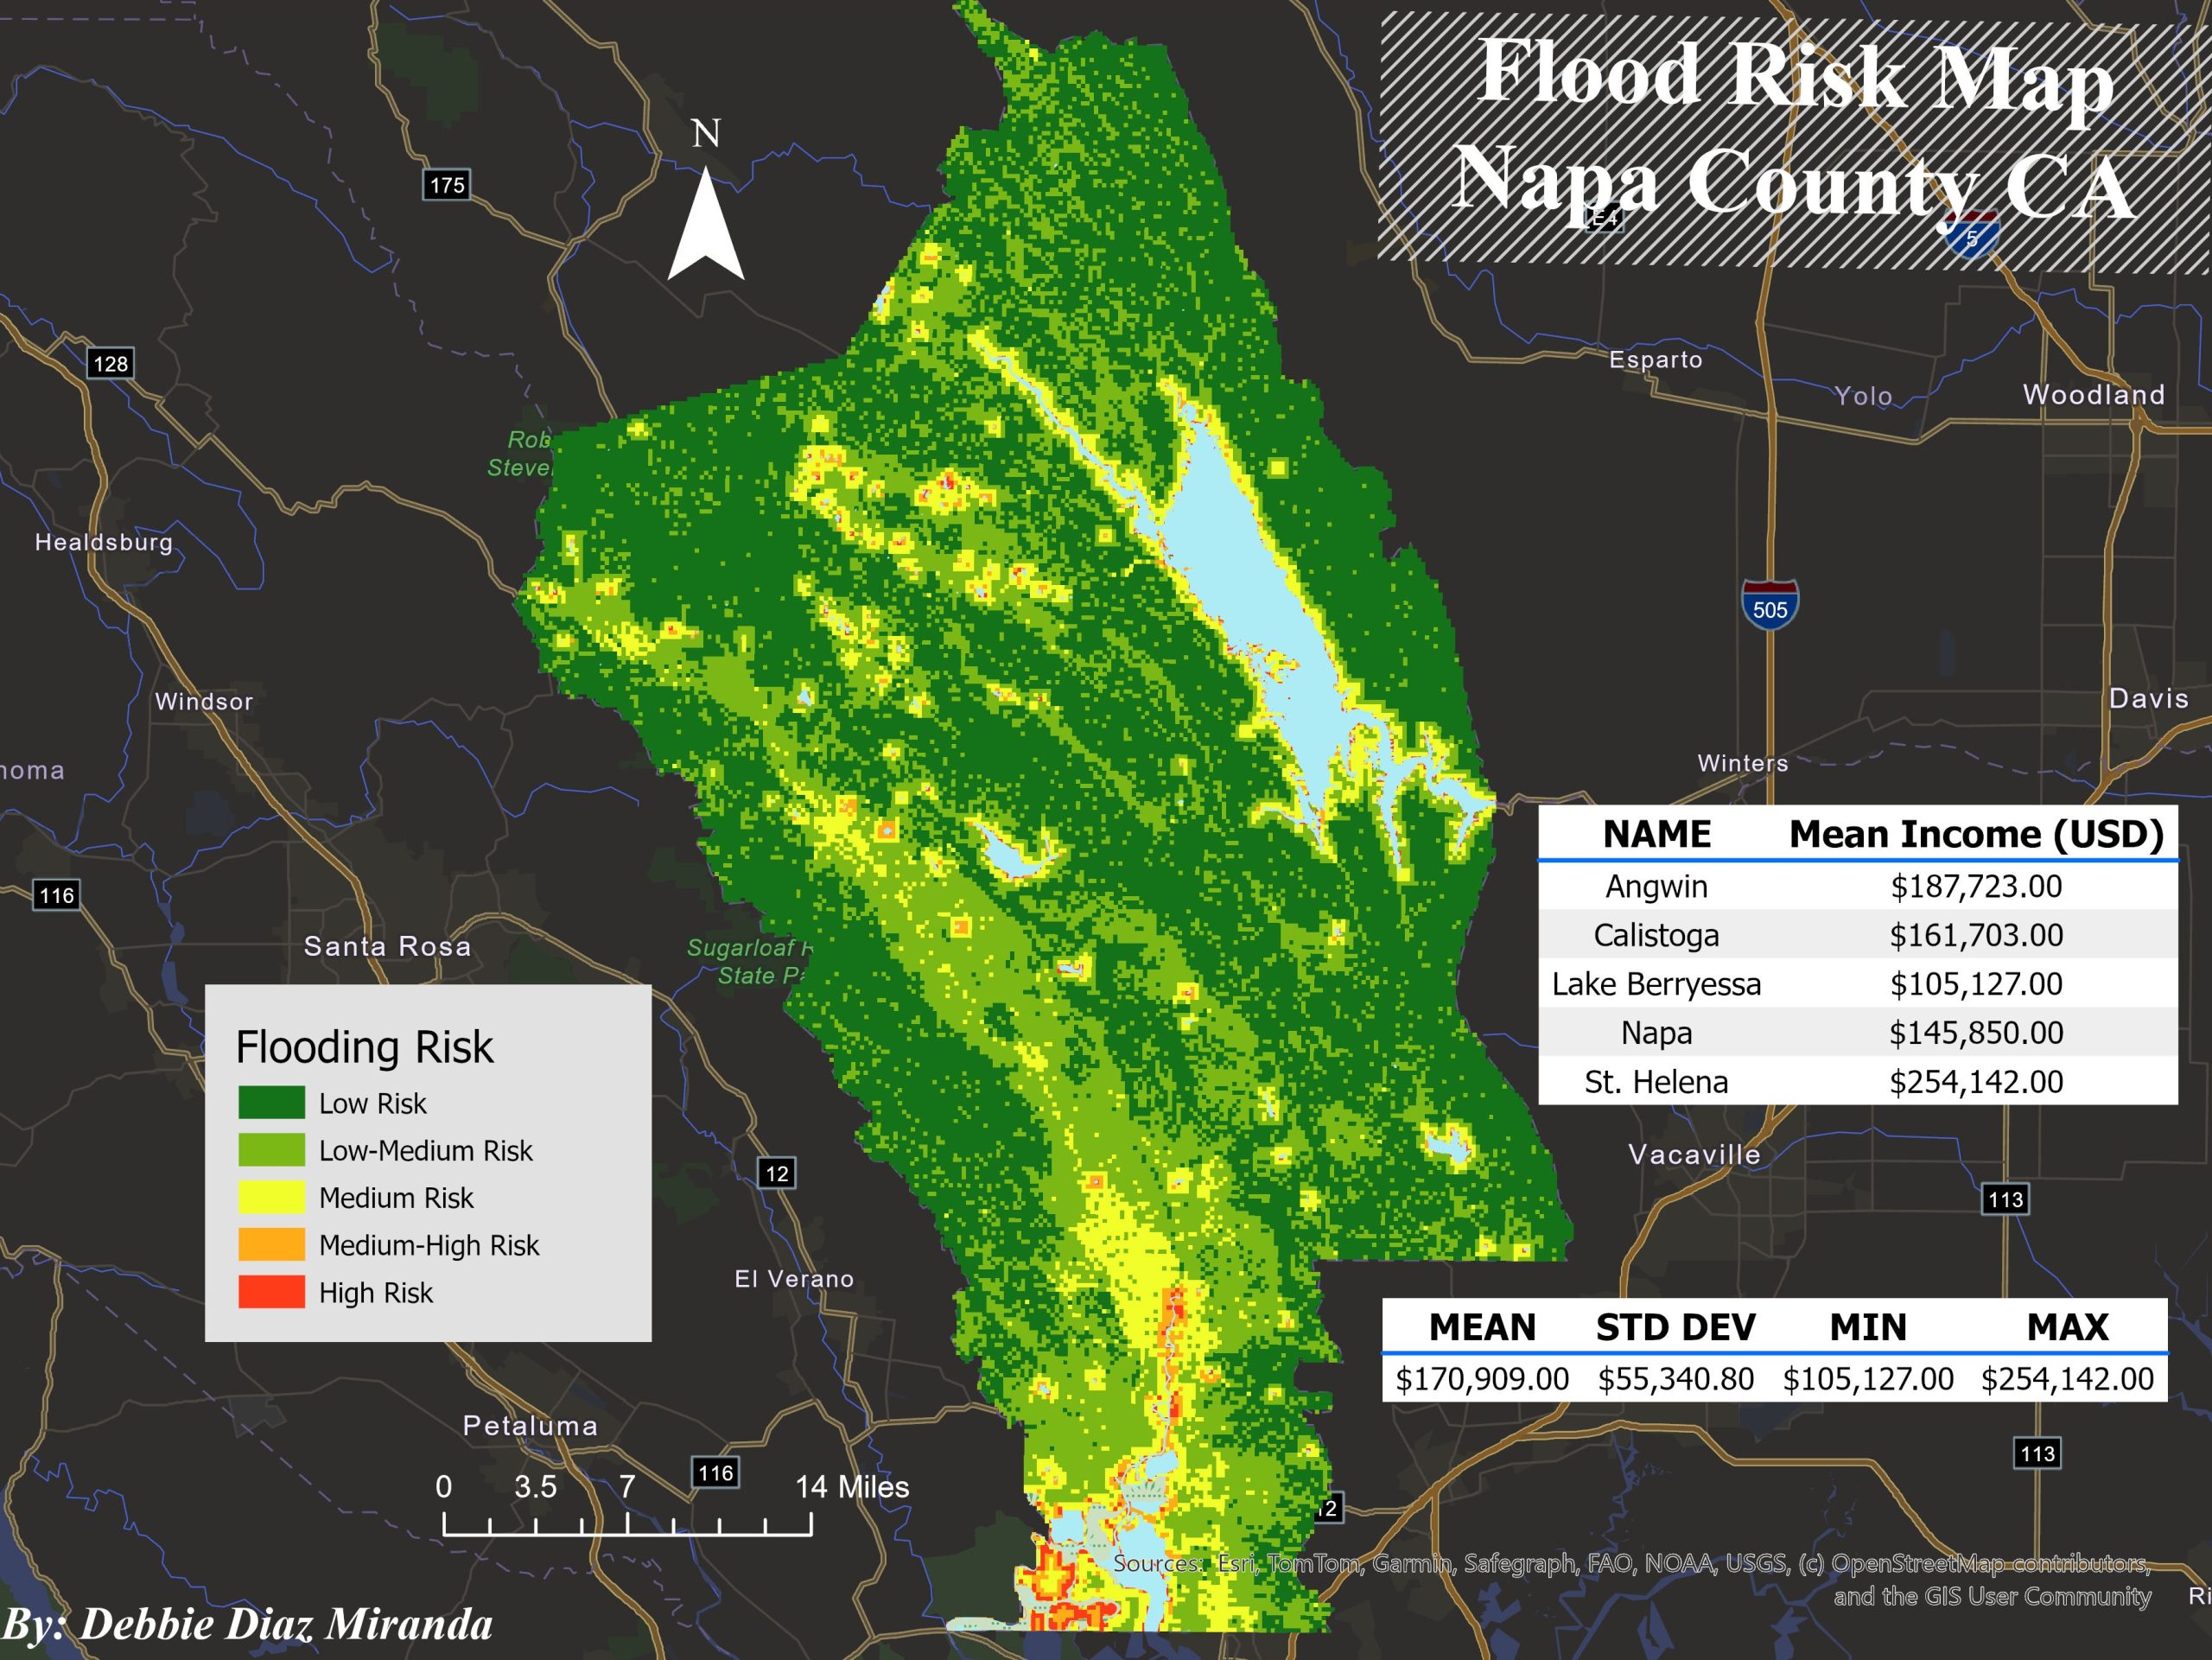
Flood Risk Assessment of Napa County
This project integrates slope, land cover, and proximity to water bodies within a structured ArcGIS Pro geoprocessing workflow. Using a custom ModelBuilder model, slope was derived from a DEM and reclassified into five susceptibility classes; land cover was reclassified based on hydrologic behavior per U.S. Army Corps of Engineers guidance, and distance to water bodies was calculated and categorized by risk level. These layers were combined through a Weighted Overlay Analysis (40% water proximity, 35% land cover, 25% slope), with socioeconomic context added via median household income from U.S. Census Block Group data.
Deliverables included a county-wide flood-risk raster and an interactive web map with Census Block Group attribute pop-ups. Results revealed a clear valley-to-upland risk gradient, with high-risk zones concentrated along the Napa River and its tributaries. The integration of income data further highlighted exposure disparities, supporting more equitable emergency planning, infrastructure protection, and mitigation strategies.
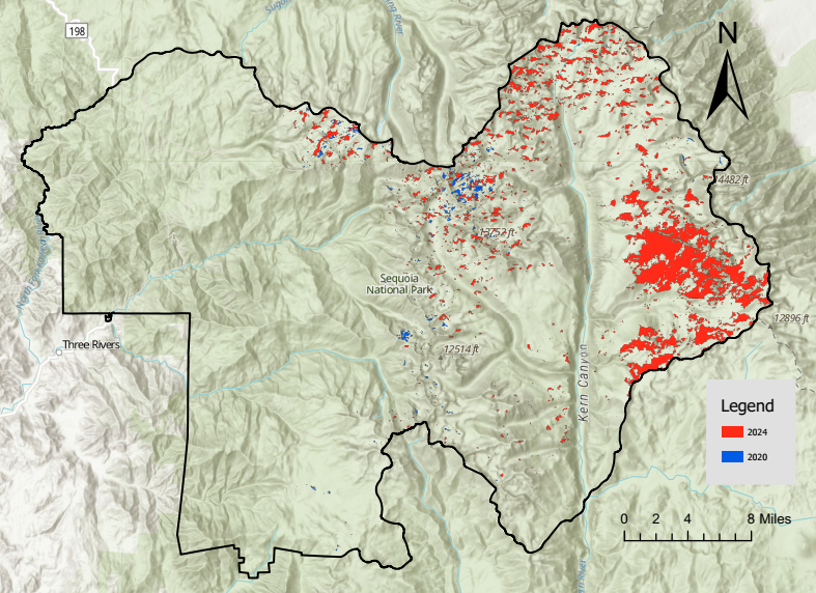
Snow Cover Comparison in Sequoia National Park
This project compared early-winter snow cover in Sequoia National Park during December 2020 and December 2024 to evaluate how interannual climate variability influences seasonal snowpack, using Landsat-8/9 satellite imagery filtered for low cloud cover (0–20%). Snow presence was classified using the Normalized Difference Snow Index (NDSI), applying a threshold of NDSI > 0.4 to map snow-covered areas across both years.
Deliverables included processed Landsat imagery, NDSI-based snow cover maps, and a comparative assessment of spatial differences between the two winters. Results showed thinner snow cover in 2020 despite reduced pandemic-era emissions, likely driven by warmer temperatures and a regional snow drought, while 2024 exhibited near-average snowpack from several storm events, even during a La Niña year. These findings highlight how short-term climate variability can outweigh temporary emissions reductions in shaping seasonal snow performance.
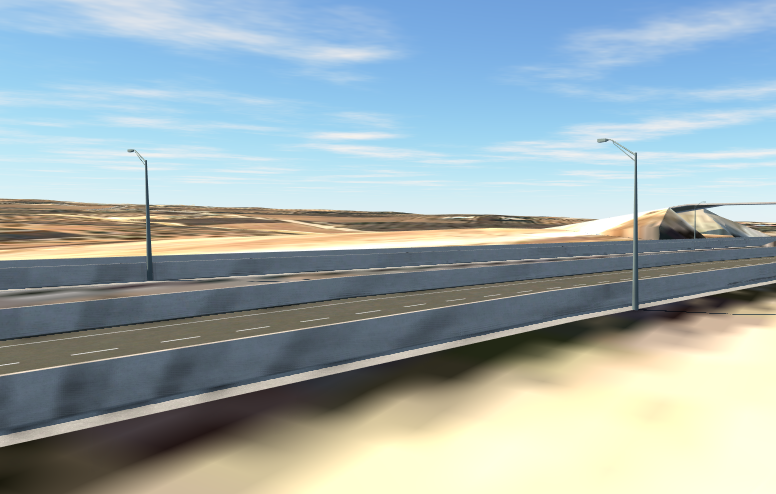
BIM-Based Highway Infrastructure Project
(Yecla – Caudete)
This project developed the conceptual and preliminary BIM-based design of a 4-km segment of the A-33 highway between Yecla and Caudete, Spain, in collaboration with Eng. Josué Hernández. Using a multi-platform BIM workflow (InfraWorks, Civil 3D, Revit, Navisworks, Arquímedes, and BIMcollab Zoom), the project integrated roadway geometry, structures, drainage, lighting, and affected services into a coordinated federated model. Terrain surfaces were built in Civil 3D from CNIG geospatial data and point cloud processing, supporting corridor design at a 110 km/h design speed, while structural elements, including two bridges, beams, decks, piers, and piles, were detailed in Revit with reinforcement strategies and IFC4 export.
Deliverables included conceptual corridor models, structural reinforcement sheets, drainage and affected-services mapping, IFC models, clash-detection reports, and 4D construction-sequence simulations linked to 5D cost budgeting. The integrated BIM workflow enabled early conflict identification, improved stakeholder visualization, and reliable time and cost insights, supporting more efficient design coordination and contributing to enhanced connectivity and infrastructure performance between Yecla and Caudete.